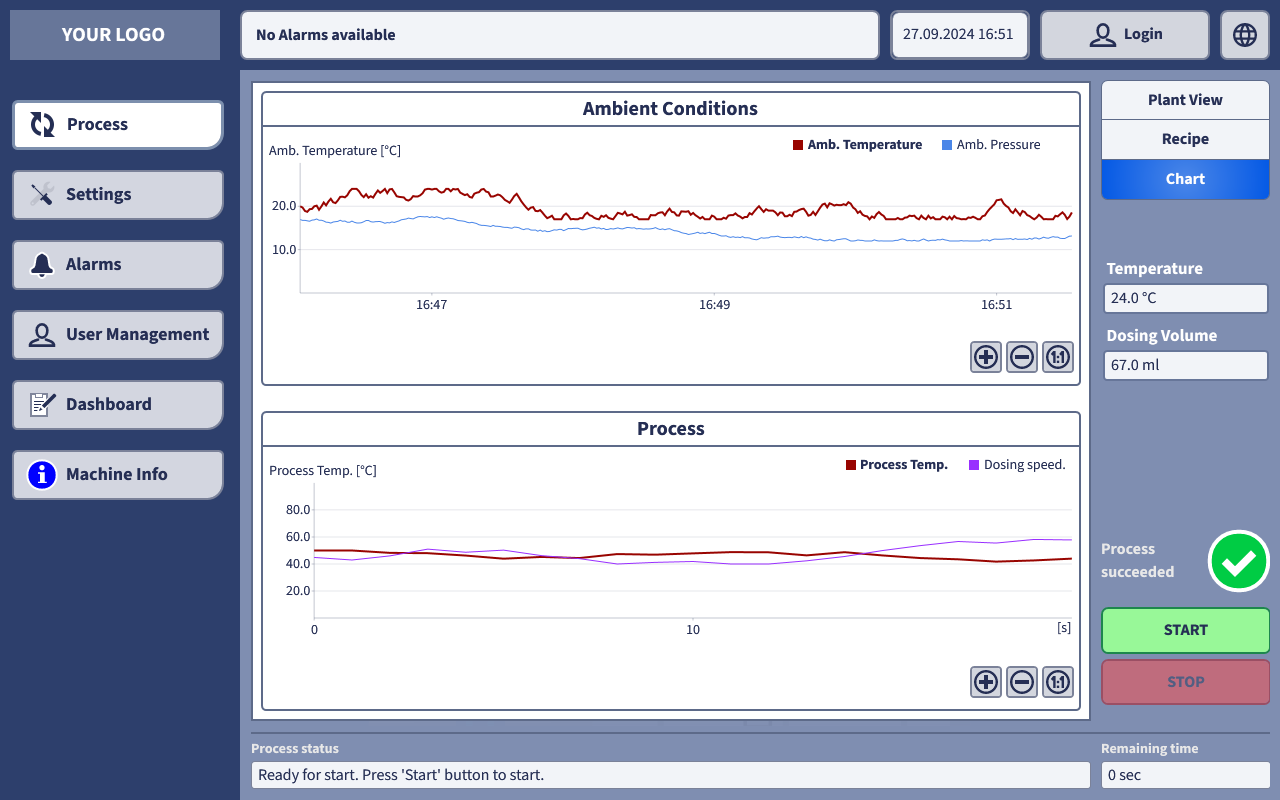
Visualize Trend Logs
The periodically recorded values can be linked to a time chart. In the time chart, for example, the time range and the Y-axis scaling can be set if these are to be specified.
Time charts are an option of the view element "Chart" and can be very individually configured in terms of color. With the "Zoom-In" function, a section can be enlarged.

Control Trend Recording with Trigger Conditions
For a chart recording, it can be specified whether the recording is active or inactive. Recordings can be deleted via datapoint control. This function is ideal if the current or last process is always to be visualized in the chart.
Periodically Record Datapoint Values in CSV Files
The CSV recording function allows datapoint values to be read cyclically and automatically appended to the end of a CSV file along with a timestamp. Alternatively, the recording can be organized into monthly or yearly files. This unlimited recording capability enables easy traceability of processes, as required in regulated industries (e.g., FDA/GMP).