Maximum Control through Local Data Storage
All machine data is stored locally – no cloud connection is required. Unified-E securely stores all trend and process data in the customer environment, ensuring maximum data security. On-premise storage also ensures high performance and independence from external systems.
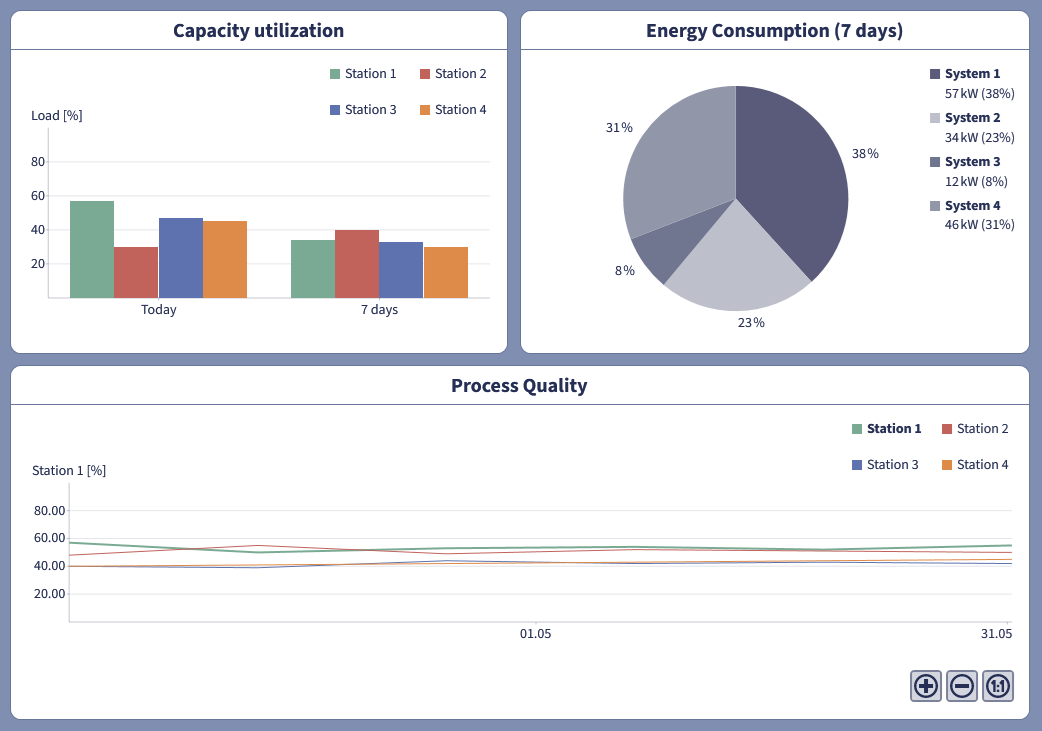
Production dashboard HMIs with trends and machine status are easy to implement with Unified-E.
Charts & Progress Indicators
Bar charts allow for quick comparison of machine or sensor data. Time charts with integrated trend logging visualize the progression of individual data points over a defined period, while line charts provide detailed representation of continuous process values. Progress indicators in the form of sliders or custom circular segments offer an intuitive way to visualize target-actual values and machine status.
Detailed Trend Analysis with Integrated Trend Logging
The Unified-E App Manager continuously stores all relevant data points and visualizes them in time charts. This on-premise solution enables long-term analysis of process data without the need for external cloud services.
Easy Configuration via the Unified-E App Designer
Chart types and progress indicators can be flexibly selected and customized. Data points from PLC controls such as OPC UA or Modbus can be directly integrated. Scales, colors, and time ranges can be adjusted to optimally display the data. Dynamic progress indicators with custom circular segments enable precise visualization of machine and process status.
Integration of External Systems for Comprehensive Data Integration
Unified-E offers seamless integration into existing production systems. The SQL adapter allows production data to be read directly from databases, while the HTTP-JSON adapter provides optional connection to APIs or external cloud systems. This allows production dashboards to be enriched with real-time information from various data sources.
Why Unified-E for Production Dashboards?
- Modern Data Visualization – Bar charts, line & time charts
- Live Data & Trend Logging – On-premise, no cloud storage
- Dynamic Progress Indicators – as sliders or with custom circular segments
- Easy Configuration – in the Unified-E App Designer, no programming required
- Data Integration – from PLCs, SQL databases & JSON APIs
Application Areas for Industrial Dashboards
- Production Monitoring – Evaluate machine performance & process data in real-time
- Error Analysis & Predictive Maintenance – Identify long-term trends
- Energy Management – Analyze & optimize consumption data
- Quality Control – Continuously monitor process parameters